Humans perceive or “see” the world as it physically is, and what we “see” remains almost the same for everyone. For example, a Rubik's Cube is “seen” as a cube, not a ball, nor a pyramid. But “seeing” is the result of a complex visual process, which involves passing many image projections from our retina to the brain’s visual cortex. Moreover, functional MRI (“fMRI”) images tell us that visual inputs projected onto the brain are distorted. So how do those distorted projections in the brain ultimately transform into the act of seeing a non-distorted world?
After 10 years of research, which was partially funded by the U.S. National Science Foundation, U.S. National Institute on Aging, and U. S. National Eye Institute, NYU Shanghai Chief Scientist and Professor of Neuroscience Zhong-Lin Lu, and his collaborators – Yalin Wang, Duyan Ta and Yanshuai Tu of Arizona State University – have developed the first complete mathematical model to describe the distortions that take place in the “retinotopic mapping” process between the eye and the visual cortex, giving us a first glimpse into how our vision gets made.
“The math in this study is complicated. But the questions we’ve tried to answer are simple,” Lu said. “We wanted to figure out the exact process of how we ‘see’ the world. What happens when images are passed from the retina to the brain? And why does the world appear to be largely the same to all of us, despite different brain structures?” The first two papers in their study were published in top medical image processing and computational biology journals, Medical Image Analysis (Vol.75) and PLoS Computational Biology (Vol.17). Two patents have been filed on quantification methods for brain mapping in the visual cortex and other sensory areas.

Clockwise from top left: Zhong-Lin Lu, Yalin Wang,Yanshuai Tu, and Duyan Ta
How Does Vision Work?
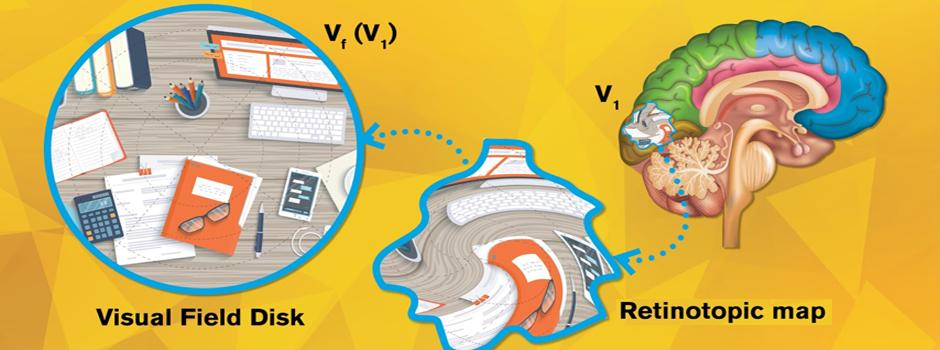
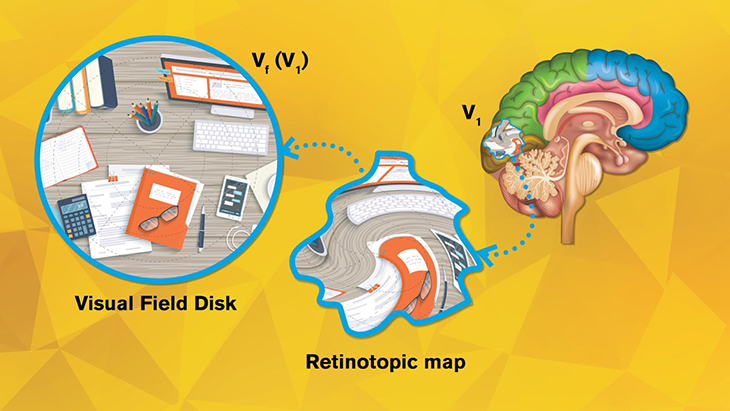
Imagine our eyes as cameras. The images captured by our eyes are reflected onto the retina, a thin layer of tissue in the back of the eye, and then projected to the visual cortex, the section in our brain that processes visual information. For each “pixel” on our retina, there’s a corresponding point on the visual cortex, forming a “topological” relation. Neuroscientists use functional magnetic resonance imaging (fMRI) to record and visualize this point-to-point projection in what is called a retinotopic map.
Credit: Rhonda Hitchcock-Mast/Arizona State University
The visual cortex can be divided into multiple areas, known as V1, V2, V3, etc. (There can be over 10 visual areas depending on how you categorize them.) Existing retinotopic maps show that when visual inputs are passed from the retina to V1, V2, … to Vn, geometric distortions take place in each step. But the precise way in which visual inputs are distorted in each step has remained a mystery.
Lu and his team knew that if each specific transformation could be precisely quantified, then they could solve this fundamental question of how vision works.
Hurdles Along the Way
It took the team ten years to achieve a breakthrough. As an interdisciplinary study across vision science, fMRI and differential geometry, it was crucial for all team members to understand each other’s work. Lu said the team met almost every week over the past ten years. Lu, a vision and fMRI expert, worked hard to understand the math, while Wang and his students Ta and Tu had to develop expertise in vision science. Most importantly, they had to work together to come up with the right questions and solve them.
Another hurdle was the lack of usable data. For several years, the quality of fMRI images was too low, failing to preserve the topological detail Lu’s team needed for their analysis. With data from ultra high strength 7-Tesla MRI systems collected by the Human Connectome Project, the researchers were finally able to generate usable retinotopic maps.
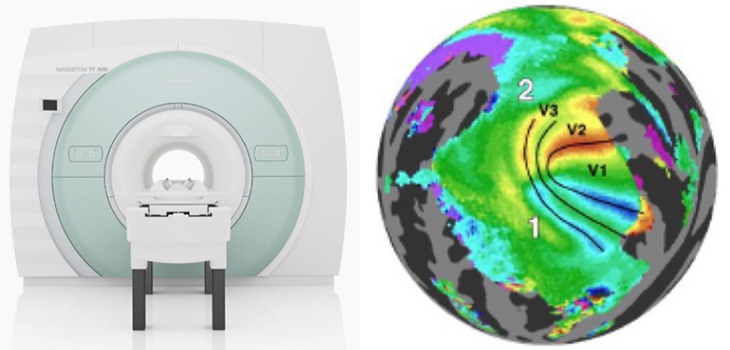
[image: 7-Tesla fMRI machine + Retinotopic Map Sample from Human Connectome Project Database]
“We figured out the ‘f’.”
To quantify the transformations of retinotopic maps, Lu and his collaborators created a mathematical framework by applying the principles of computational conformal geometry and quasiconformal Teichmüller theory. Their framework translates the pictorial representation of the retinotopic map into a complete mathematical description, making it possible to apply data analysis tools to characterize retinotopic maps at both individual and population levels.
“If we compare this to a mathematical function, y=f(x),” Lu said, “‘x’ would be visual inputs and ‘y’ would be the corresponding projections on the visual cortex. From the existing ‘x’s and ‘y’s, we figured out the ‘f’. Now given any image (x), using the framework, we can know its exact projection (y) on the visual cortex. We can also reverse the process, that is, given any visual cortical recordings (y), we can infer what the person was seeing (x). ”
Lu and his fellow researchers first determined whether the distortions in retinotopic mapping between the retina and V1 are conformal or quasiconformal, quantifying the precise amount and direction of visual input distortion in each local region of the cortical surface using the Beltrami coefficient (BC), a differential geometry concept that measures angle distortions in quasiconformal maps. The researchers then combined the collection of BCs to form a Beltrami coefficient map (BCM) describing the precise distortion at every point on the retinotopic map.
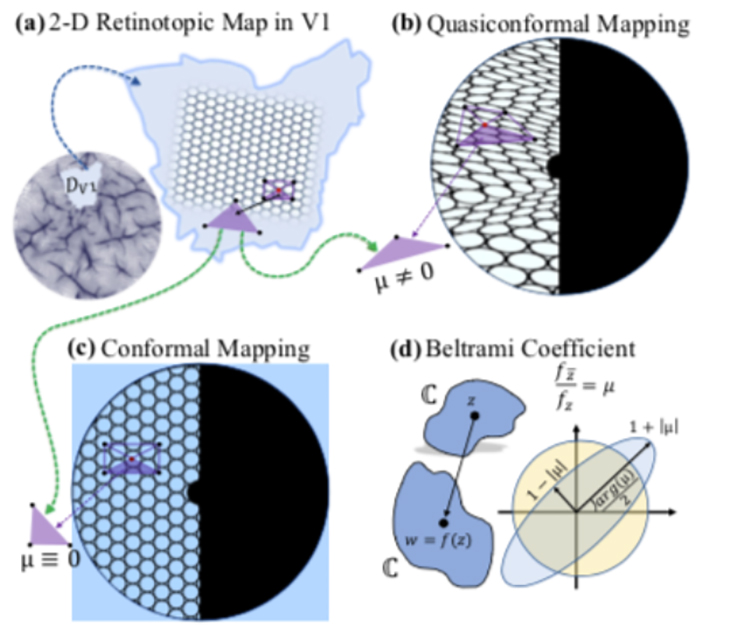
The new framework was then applied to V1 retinotopic maps from the Human Connectome Project, the largest state-of-the-art retinotopy dataset currently available. The results showed that the transformation from the retina to V1 is quasiconformal, meaning that the shapes of visual inputs are distorted but not torn.
Looking into the Future
Team members are already building on their research. Since the published study focuses solely on the mapping between the retina to V1, mappings between V2, V3, V4, etc… are waiting to be quantified as well. The team is also applying the method in different populations to see if individual differences in brain and neuron structures create differences in individual visual perception. The team’s quantification framework can also be applied to topological mappings in other sensory systems of the brain, which could revolutionize our understanding of brain function.
The quantification technique also holds promise for the development of new treatments for eye diseases such as glaucoma and cortical blindness, since it can enable researchers to precisely identify which specific steps in the vision process go wrong in people suffering from these disorders.